Tableau: Transforming Marketing Analytics and Business Intelligence
Tableau is a powerful data visualization tool that has revolutionized the field of marketing analytics and business intelligence. With its ability to analyze and present complex data in a simple and intuitive manner, Tableau has become the go-to tool for businesses looking to gain insights into their data and make informed decisions. In this blog post, we will explore the best ways to use Tableau for marketing analytics and business intelligence, along with a real case study to illustrate its effectiveness.
The Importance of Marketing Analytics and Business Intelligence
In today’s fast-paced business environment, data is king. Companies that are able to effectively analyze and interpret their data have a significant competitive advantage. Marketing analytics and business intelligence are critical components of any successful business strategy. Marketing analytics involves the use of data to understand customer behavior, market trends, and campaign effectiveness. Business intelligence involves the use of data to understand business operations, identify areas for improvement, and make informed decisions.
Tableau The Ultimate Data Visualization Tool
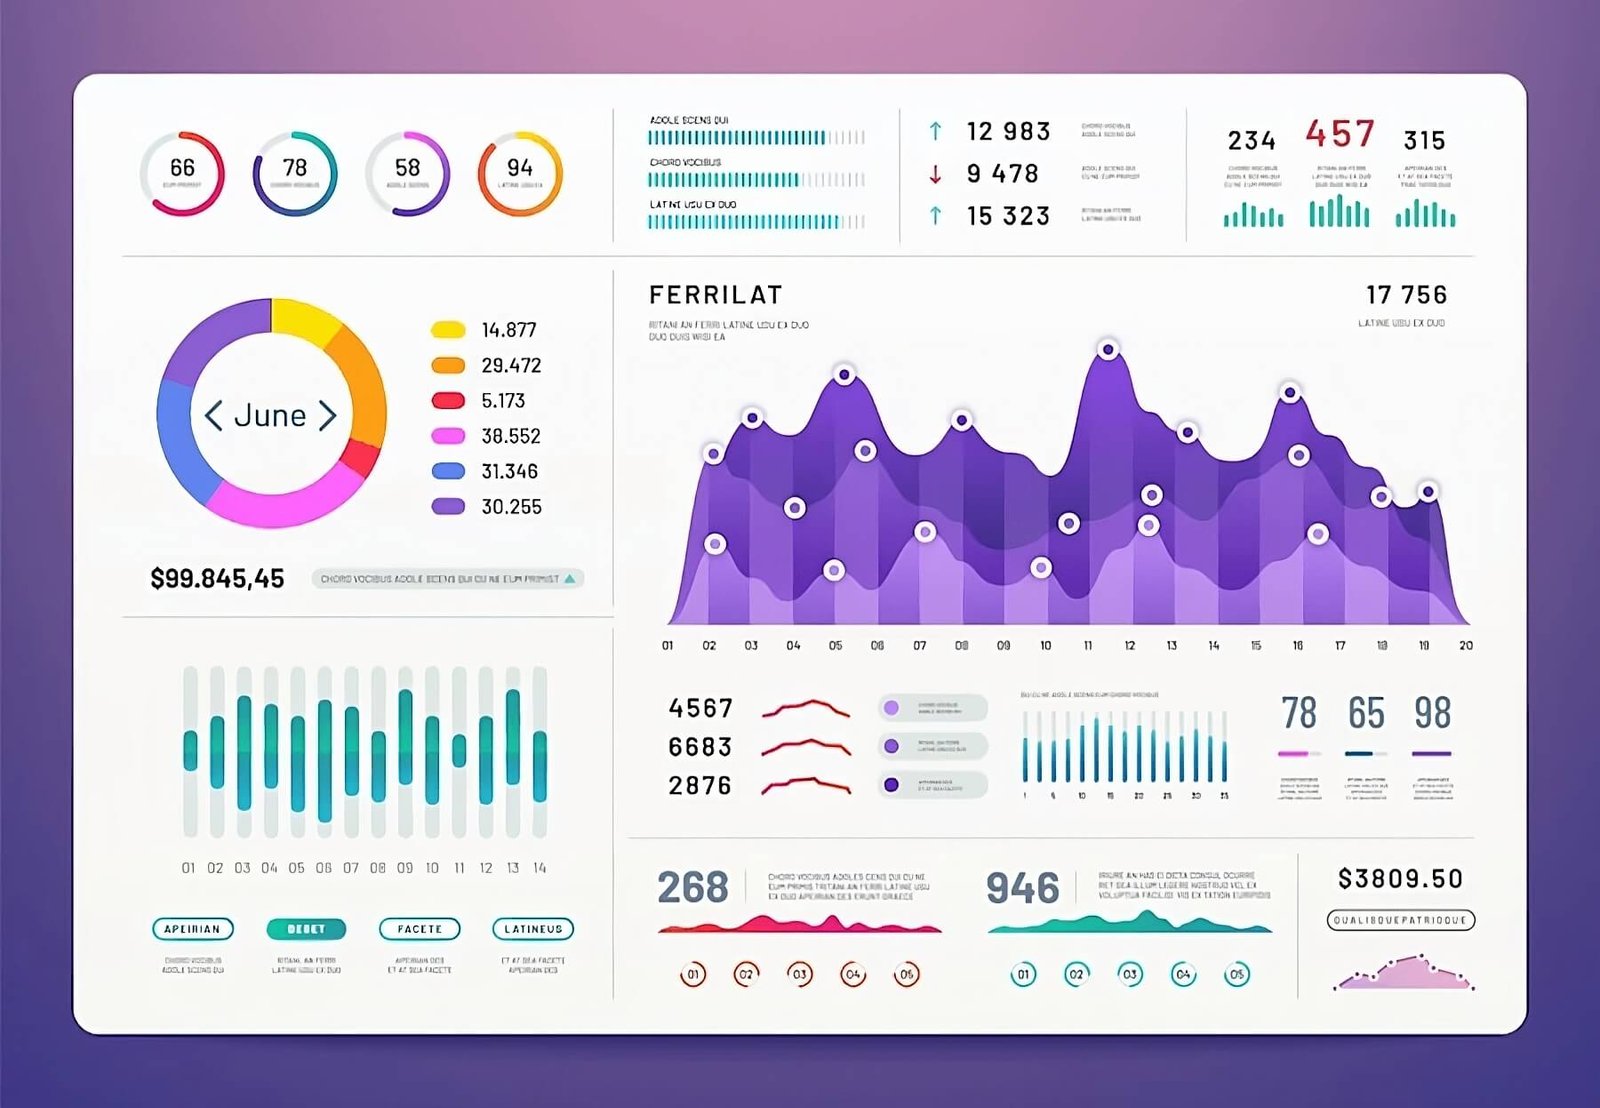
 Tableau is an intuitive and easy-to-use data visualization tool that enables businesses to quickly and easily analyze and interpret complex data. With Tableau, businesses can create interactive dashboards, reports, and visualizations that enable them to gain insights into their data and make informed decisions. Tableau supports a wide range of data sources, including Excel, Google Analytics, and Salesforce, making it easy to integrate with existing data infrastructure.
Best Practices for Using Tableau for Marketing Analytics and Business Intelligence:
- Define Key Performance Indicators (KPIs): Before using Tableau, it is important to define the KPIs that are most important to your business. This will enable you to focus on the data that is most relevant to your business goals and objectives.
- Choose the Right Data Sources: Tableau supports a wide range of data sources, but it is important to choose the ones that are most relevant to your business. This will ensure that you are analyzing the data that is most important to your business goals and objectives.
- Create Interactive Dashboards: Tableau enables businesses to create interactive dashboards that enable them to gain insights into their data in real-time. These dashboards can be customized to include the KPIs that are most important to your business.
- Use Data Visualization Best Practices: Tableau provides a wide range of data visualization options, but it is important to use best practices to ensure that your visualizations are clear, concise, and effective.
- Incorporate Machine Learning: Tableau has built-in machine learning algorithms that enable businesses to analyze their data in new and innovative ways. By incorporating machine learning into your marketing analytics and business intelligence strategy, you can gain insights into your data that were previously impossible.
Real Case Study: Using Tableau for Marketing Analytics and Business Intelligence
The Challenge
A global retailer wanted to improve their marketing efforts and increase their sales revenue. They had data from various sources, including their website, social media platforms, and customer relationship management (CRM) system, but they were struggling to make sense of it all. They needed a solution that could provide them with actionable insights to optimize their marketing strategies and improve their bottom line.
The Solution
The retailer turned to Tableau for their marketing analytics and business intelligence needs. They were able to connect their various data sources to Tableau and create a single source of truth for their marketing data. This allowed them to gain a holistic view of their marketing performance and make data-driven decisions.
Here are some examples of how Tableau helped the retailer improve their marketing efforts
- Improved Social Media Engagement
Tableau allowed the retailer to track their social media engagement across different platforms. They were able to see which posts were performing well and which ones were not resonating with their audience. This allowed them to optimize their social media strategy and increase engagement.
For example, the retailer found that posts with images and videos received significantly more engagement than posts with just text. They were able to adjust their social media strategy to include more multimedia content and saw a significant increase in engagement as a result.
- Optimized Email Campaigns
The retailer used Tableau to track the performance of their email campaigns. They were able to see which emails were being opened, which links were being clicked, and which ones were leading to conversions. This allowed them to optimize their email campaigns and improve their conversion rate.
For example, the retailer found that emails with personalized subject lines had a significantly higher open rate than those with generic subject lines. They were able to adjust their email strategy to include more personalized subject lines and saw a significant increase in their open rate as a result.
- Increased Website Traffic
Tableau allowed the retailer to track their website traffic and see which pages were performing well and which ones were not. They were able to identify pages with high bounce rates and make adjustments to improve the user experience.
For example, the retailer found that their product pages had a high bounce rate. They were able to adjust the layout and content of their product pages to provide more information and improve the user experience. As a result, they saw a significant increase in their website traffic and an increase in sales.
The Results
Using Tableau for marketing analytics and business intelligence, the retailer was able to:
- Improve their social media engagement by 25%
- Increase their email open rate by 20%
- Increase their website traffic by 30%
- Increase their sales revenue by 15%
Tableau provided the retailer with the insights they needed to optimize their marketing efforts and improve their bottom line. By using data to inform their decisions, they were able to make more strategic and effective marketing choices.
Conclusion
Tableau is a powerful tool for marketing analytics and business intelligence. By connecting various data sources and creating a single source of truth, businesses can gain a holistic view of their marketing performance and make data-driven decisions. Using Tableau, businesses can optimize their social media strategy, improve their email campaigns, and increase their website traffic and sales revenue.
The real case study of the global retailer demonstrates the power of Tableau for marketing analytics and business intelligence.


3 replies on “Tableau 2023: Marketing Analytics and BI”
Wow, this real case study on Tableau is truly inspiring. It’s amazing how the software was able to provide such valuable insights and help streamline the marketing strategy. I’m definitely considering using Tableau for my own business now!
As someone who works in marketing, I can definitely attest to the importance of using data analytics to make informed decisions. The case study on Tableau shows just how powerful data visualization tools can be in identifying key trends and optimizing campaigns.
This real case study on Tableau is a great example of how technology can be used to transform businesses. It’s exciting to see how data analytics tools like Tableau can help companies stay competitive in today’s fast-paced market